Introducing iPECS Analytics
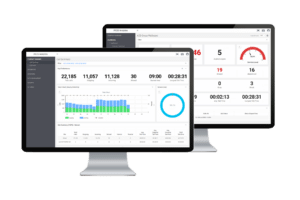
Gain complete visibility of all call traffic and call costs for single or multiple sites via easy-to-view wallboards, all in real-time.
Discover iPECS Analytics at a glance:
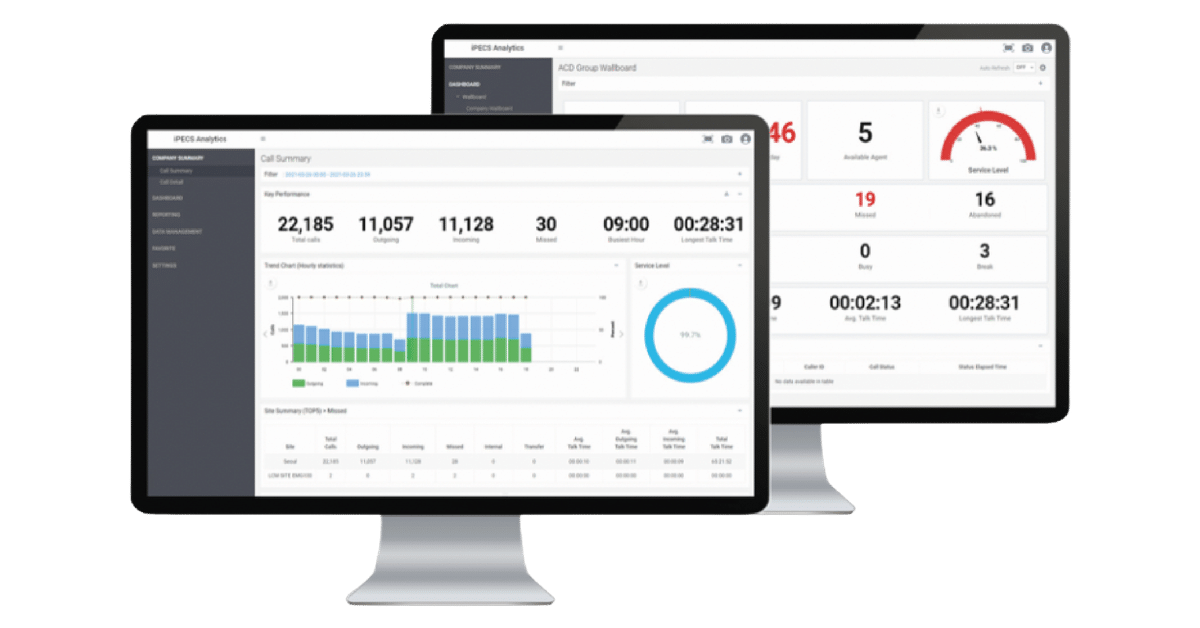
- Key performance metrics: Total calls, outgoing, Incoming, Missed, Busiest time, Longest talk time
- Easy to read trend chart: Incoming/outgoing/Complete ratio, Incomplete, Total talk time in circulating
- Service level: Percentage of total answered call in target answer time over total calls
- Top 5 report for Site, User and DDI by key metric: Total, outgoing, incoming, missed
Major Features
ACD Group Wallboard
Real time monitoring for ACD groups
Hunt Group Wallboard
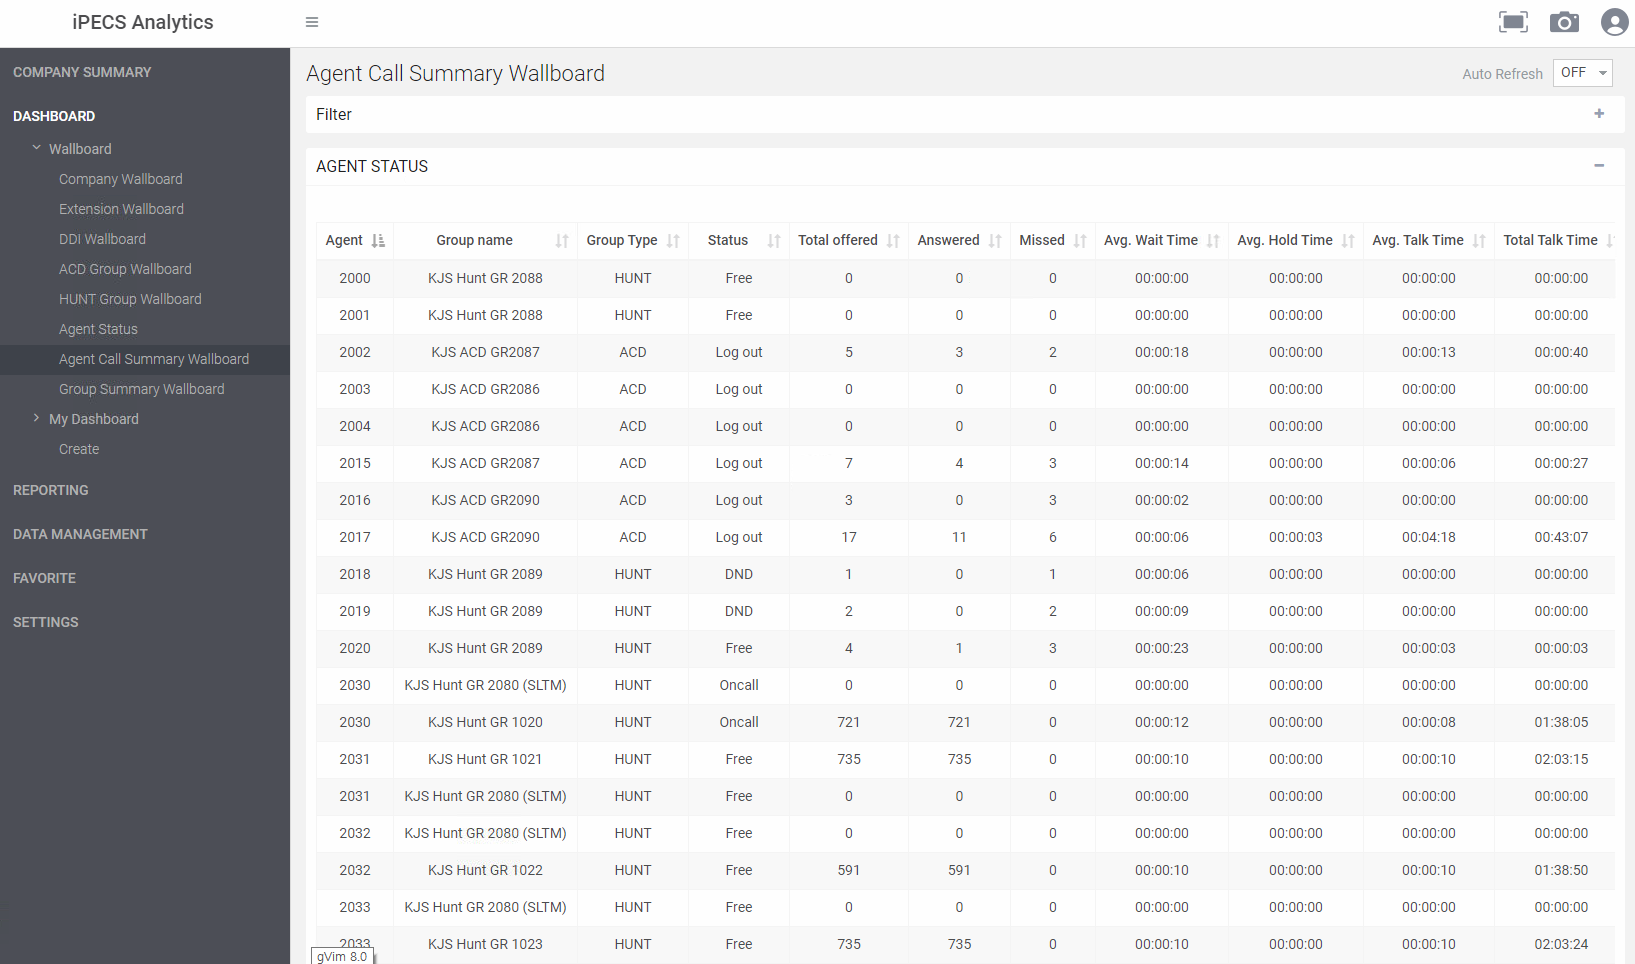
Real time monitoring for Hunt Groups
test
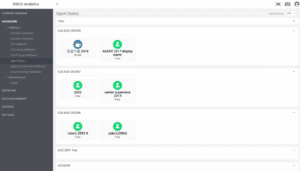
Agent Status Wallboard
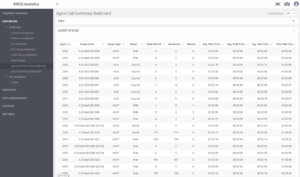
Agent/Group Call Summary
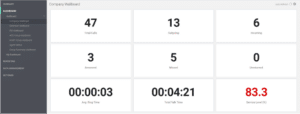
Standard Wallboard
My Dashboard
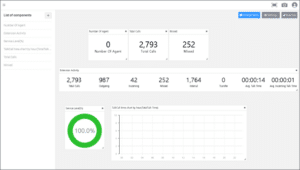
ACD/Hunt Group Report
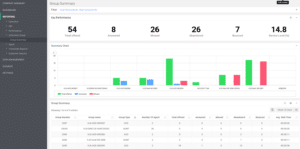
Agent Report
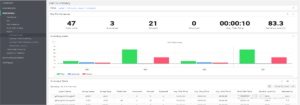
Extension Report

iPECS Analytics Reporting
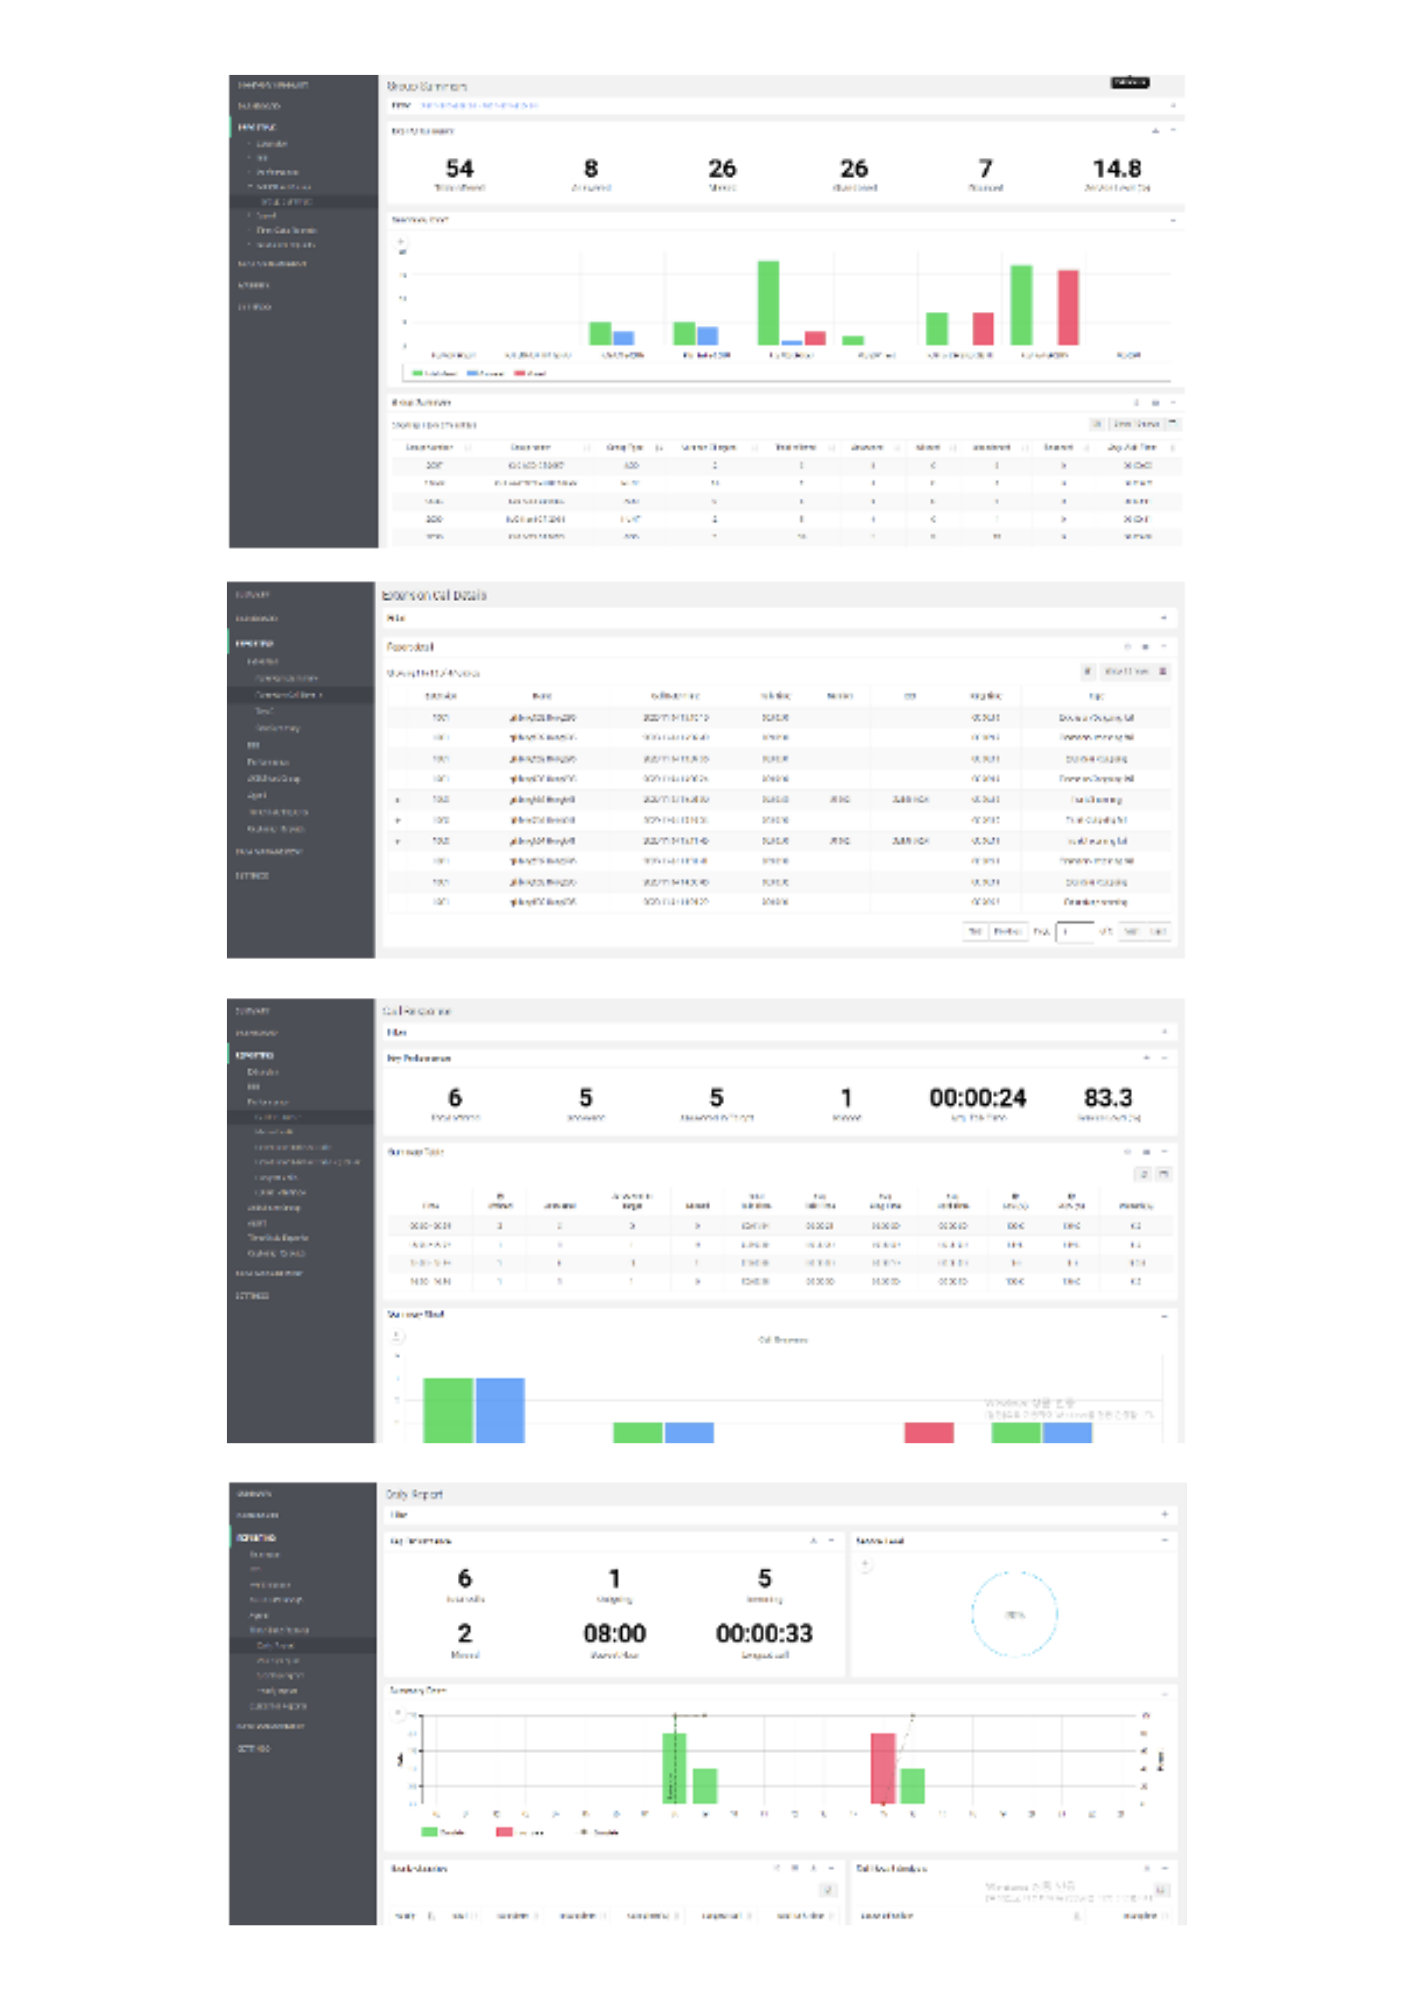
iPECS Analytics is a powerful call reporting tool that can help businesses dramatically enhance productivity through a suite of reports designed to quickly display data relating to core metrics and KPIs from a global company view to individual agents and calls.
Powerful Visual Data
Accessed via a browser, Analytics allows for maximum flexibility without the hassle of managing local application installs.
Easy-to-understand reports ensure that iPECS Analytics data is easy to consume and interpret for any business.
Keeping an eye on performance levels is easy with the ability to view call data by Company, Group, Agent, User and DDI number.
Reports can be quickly saved as PDF or CSV files, email directly from the app or scheduled to suit the needs of the business.
Data for every occasion
The reporting function in iPECS Analytics ensures that nothing is missed when it comes to analysing inbound call data. Missed calls and poor call handling can cost businesses dearly, but with a selection of detailed reports, it is possible to quickly analyse call traffic, spot problems and put them right.
Multiple reports are available via the iPECS Analytics dashboard to help businesses analyse every aspect of their inbound call traffic:
Company: This top-level report allows businesses to get a great overview of their inbound traffic with the ability to view data based on:
KPIs:
- Total calls
- Outgoing / Incoming Calls
- Misesed Calls
- Busiest Time
- Longest Call Time
Extension & DDI Summaries: These reports provide a good summary of call details including the option of “Top 5” for extensions in terms of performance
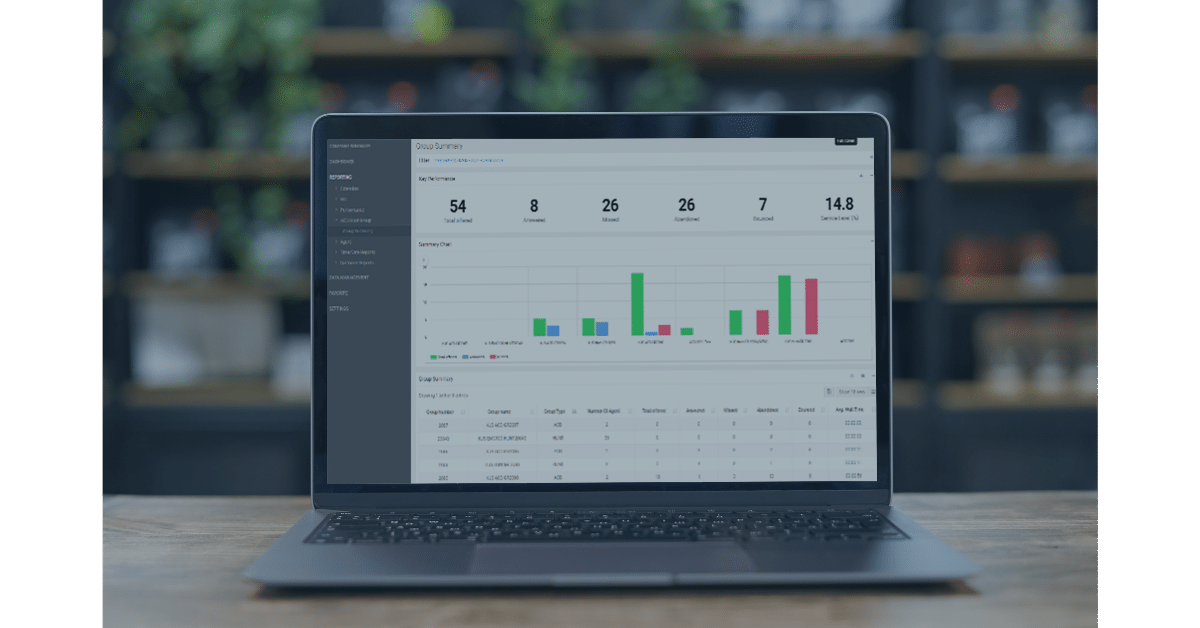
- Hunt Group/ACD: For those businesses with groups of employees setup in Hunt or ACD groups, this report provides a detailed insight into how those teams are handling calls. Each report is split into three areas:
- KPIs: Total Calls, Answered/Missed/ Bounced Calls, Average Wait Time and Service Level (%)
- Summary Chart: Each report will provide a summary graph showing Total Calls. Answered Calls and Missed Calls.
- Group Summary: Each report will provide a summary table containing data for key metrics such as; Group Name, Agent Number, Incoming/Outgoing/Missed/ Abandoned calls, Wait and Talk time and Service Levels (%)
- Agents: For that next level of detail, Analytics also provide reports by Agent, ensuring that businesses can monitor individual performance levels. The agent performance reports provide detail on:
- Call Summary: This will show similar KPI, Chart and Summary information available in the Hunt Group reports
- Active Time Summary: For a specified period it is possible to view; Call Handling time, log-in time, available time and break time.
- Availability History: Displays details relating to log-in, log-out, ready and break status over a selected period.
- Customer: These reports provide call summary and detailed information by customer and area.
- Time/Date: Ensuring that businesses can determine which are the busiest periods across days/week/ months/years, this set of reports also provides call failure analysis and reasons.
- Performance: A selection of performance-related reports provide detail on; Response Times, Missed/ Unanswered Calls by caller, Longest calls and Caller tolerance.
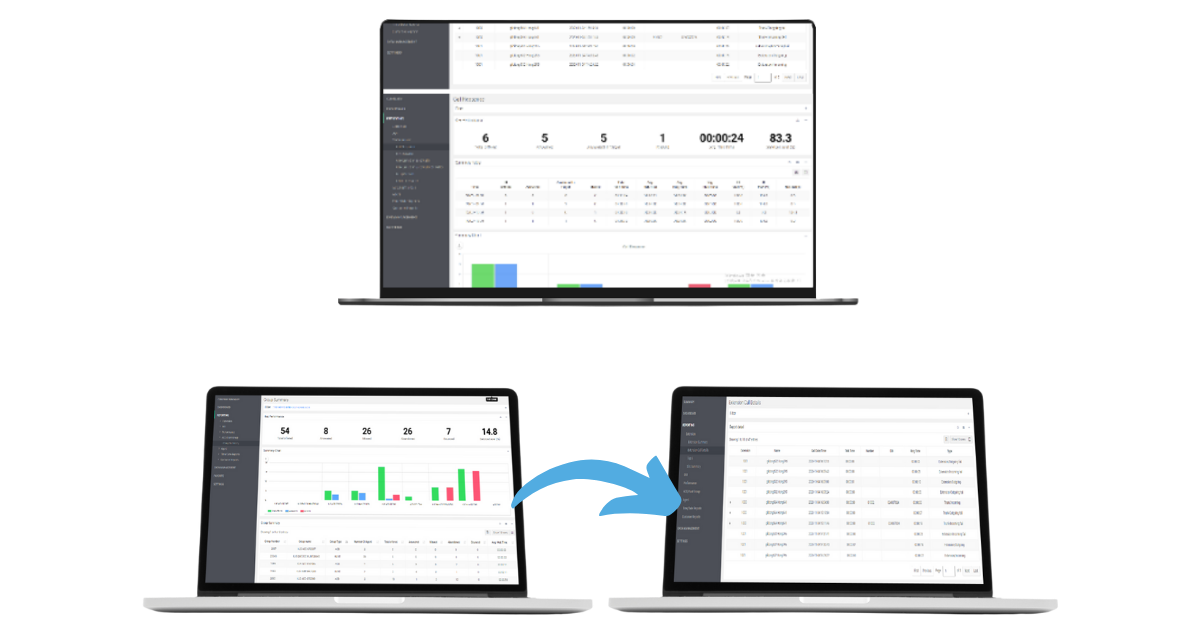
iPECS Analytics Wallboard
iPECS Analytics delivers a power Wallboard function to complement the detailed reporting that is available. For businesses that have teams providing customer service or support, wallboards can dramatically improve service levels from minute to minute with the ability to quickly and easily spot problems and fix them.
Powerful visual data:
- Accessed via a browser, Analytics allows for maximum flexibility without the hassle of managing local application installs.
- Easy-to-read wallboards provide critical data on Company, Group and Individual Performance.
- Adapt to changing volumes and fix issues quickly.
- Fully customisable “My Wallboard” function for maximum flexibility.
- Monitor service levels in real time.
iPECS Analytics Wallboards are designed to help businesses maximise their service levels through clearly displayed data points. Where required, businesses can also benefit from data displayed and updated in real-time to ensure that they constantly react to call volumes and deliver the best possible service levels to their customers.
Historical and Realtime Data: Whether it is basic historical data that is refreshed at regular intervals or real-time data displayed as it happens, iPECS Analytics has several wallboard options. In addition, multiple reports are available via the iPECS Analytics dashboard to help businesses analyse every aspect of their inbound call traffic:
Company Summary: The company summary wallboard offers a snapshot of key metrics. The Company Summary wallboard displays:
- An easy-to-read trend chart
- Service level based on the total percentage of calls answered within a pre-defined target time
- Top 5 summary report based on overall stats
- Top 5 users
- Top 5 DDI numbers
Extension & DDI: Both of these wallboard display data in the same way, with KPIs, boldly displayed for quick and easy understanding as well as an extension or DDI summary list. In addition, each wallboard shows data for a single extension or DDI, rotating around the top 10 extensions or DDIs.
ACD Group – Real-Time Monitoring: The ultimate wallboard option in Analytics, designed for businesses with busy support and customer services teams, the ACD Wallboard delivers critical data as it happens. Supervisors and team leaders can quickly and easily see essential information such as; Call In Queue, Longest WaitTime, Available Agents and live Service Levels. Any issue is highlighted promptly in red, allowing the business to log agents out of other groups and help. Additionally, the ACD Wallboard will provide a view of live calls in progress.
Hunt Group – Real-Time Monitoring: Where businesses do not utilise the added functionality of ACD, Analytics can still provide a good level of data to standard Hunt Groups. It is still possible to display a small amount of crucial, real-time data in this wallboard, allowing supervisors and managers to view information including; Longest Talk Time, Average Wait Time, Missed calls and Total Agents. Data around break times queued calls and average/abandoned times are only available to ACD groups.
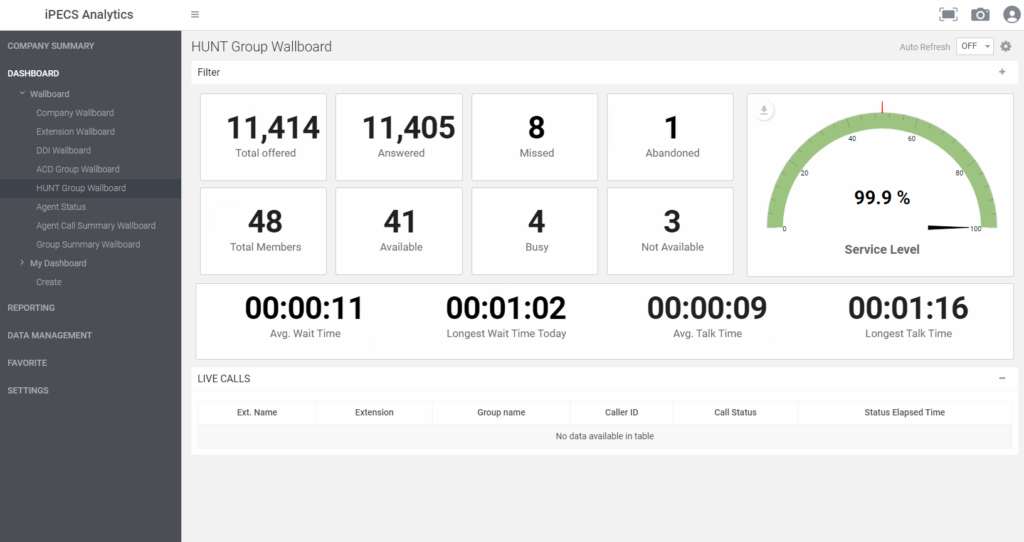
Agent Status: This wallboard is available to ACD and Standard Hunt Groups. It allows supervisors and managers to get a real-time view of critical agent status metrics such as:
- ACD: Free, Ringing, On Call, Break, Wrap-Up, Log-Out
- Hunt Group: Free, Ringing, On Call, DND, Unregistered
Agent / Group Summary: These wallboards provide real-time agent and group call summary data to the business. The wallboards offer a highly detailed view of agent and group data that includes critical metrics such as; Group name, Agent Number, Calls Offered/Answered/Missed/Abandoned/Bounced, Wait and Talk times, well as current service levels.
With iPECS Analytics Wallboards and Reporting, businesses are better able to monitor, manage and enhance their service levels.


iPECS Analytics Feature Guide
iPECS Analytics is a powerful call analytics solution fully integrated with iPECS Cloud. iPECS Analytics offers valuable insights into the communications of any business or call centre. The real-time data provided by this service empowers your team to provide a superior customer experience.

